Prometheus Web界面自带的图表是非常基础的,比较适合用来做测试。如果要构建强大的Dashboard,使用Grafana来对Prometheus采集到的数据进行可视化展示。
Grafana是用于可视化大型测量数据的开源程序,提供了强大和优雅的方式去创建、共享、浏览数据。Dashboard中显示了不同metric数据源中的数据。
Grafana最常用于因特网基础设施和应用分析,但在其他领域也有用到,比如:工业传感器、家庭自动化、过程控制等等。Grafana支持热插拔控制面板和可扩展的数据源,目前已经支持Graphite、InfluxDB、OpenTSDB、Elasticsearch、Prometheus等。
- 安装
1
2
$ wget https://s3-us-west-2.amazonaws.com/grafana-releases/release/grafana_4.2.0_amd64.deb
$ dpkg -i grafana_4.2.0_amd64.deb
下载地址:https://grafana.com/grafana/download
启动Grafana
1
$ systemctl start grafana-server
查看Grafana是否启动成功
1
$ systemctl status grafana-server
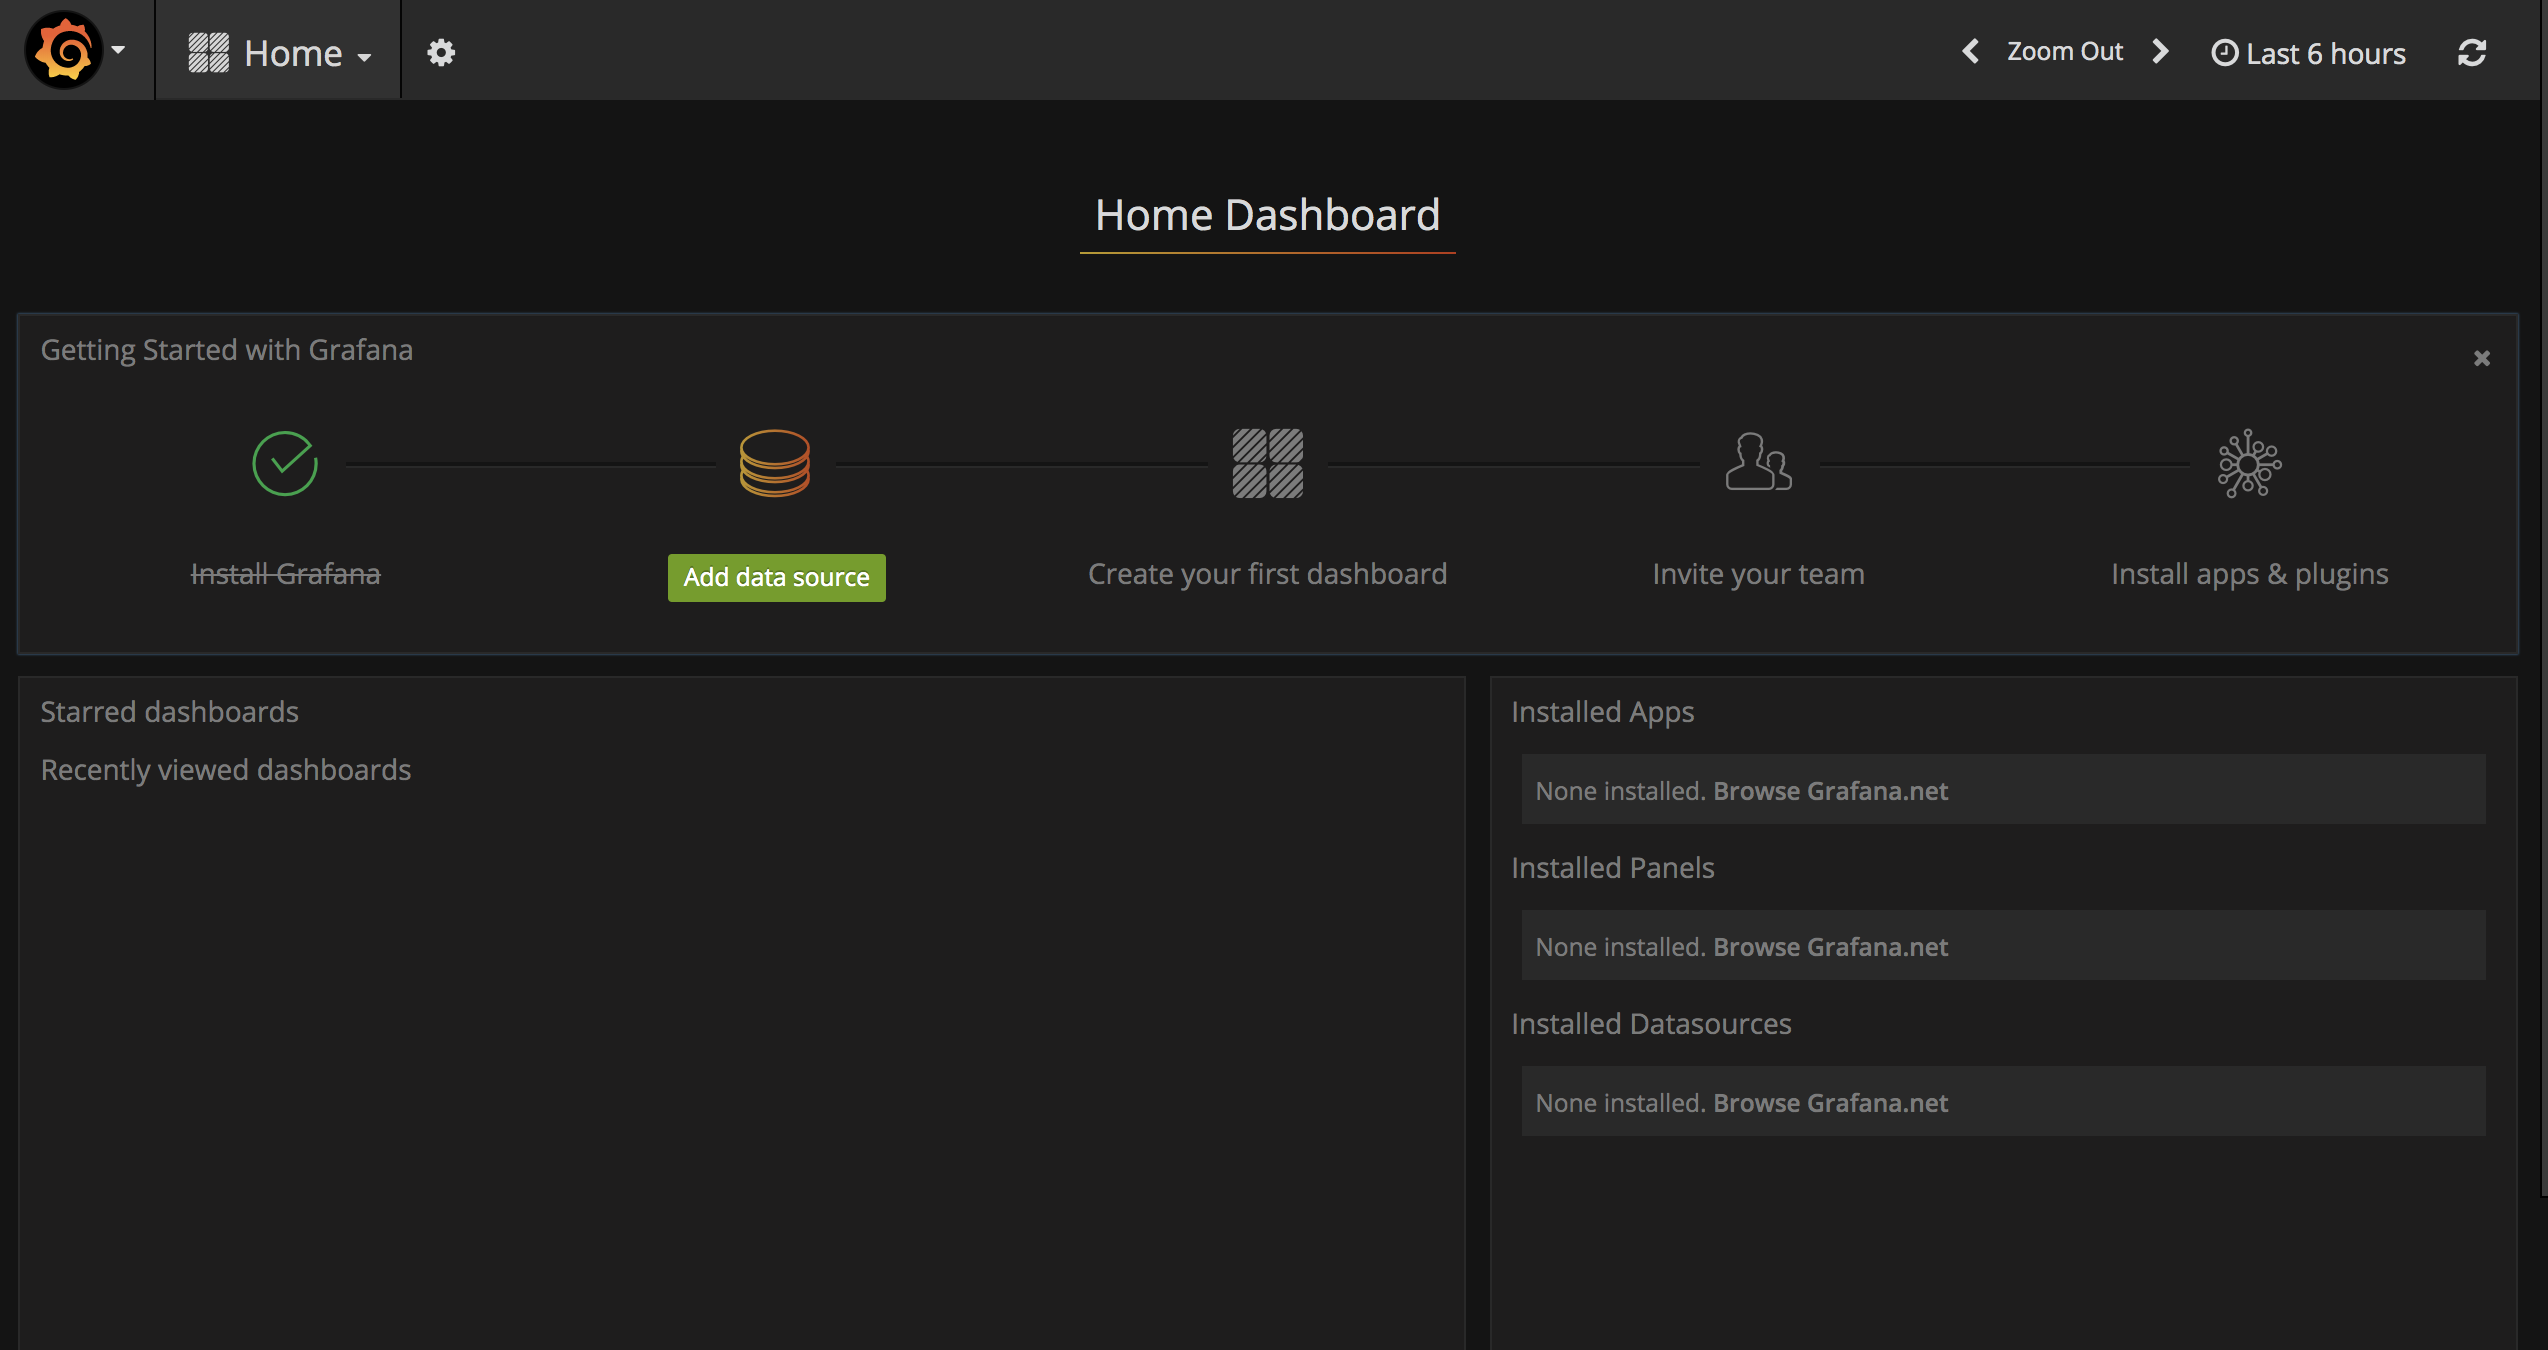
访问Grafana
通过http://ip:3000访问Grafana Web界面
缺省帐号/密码为:admin/admin
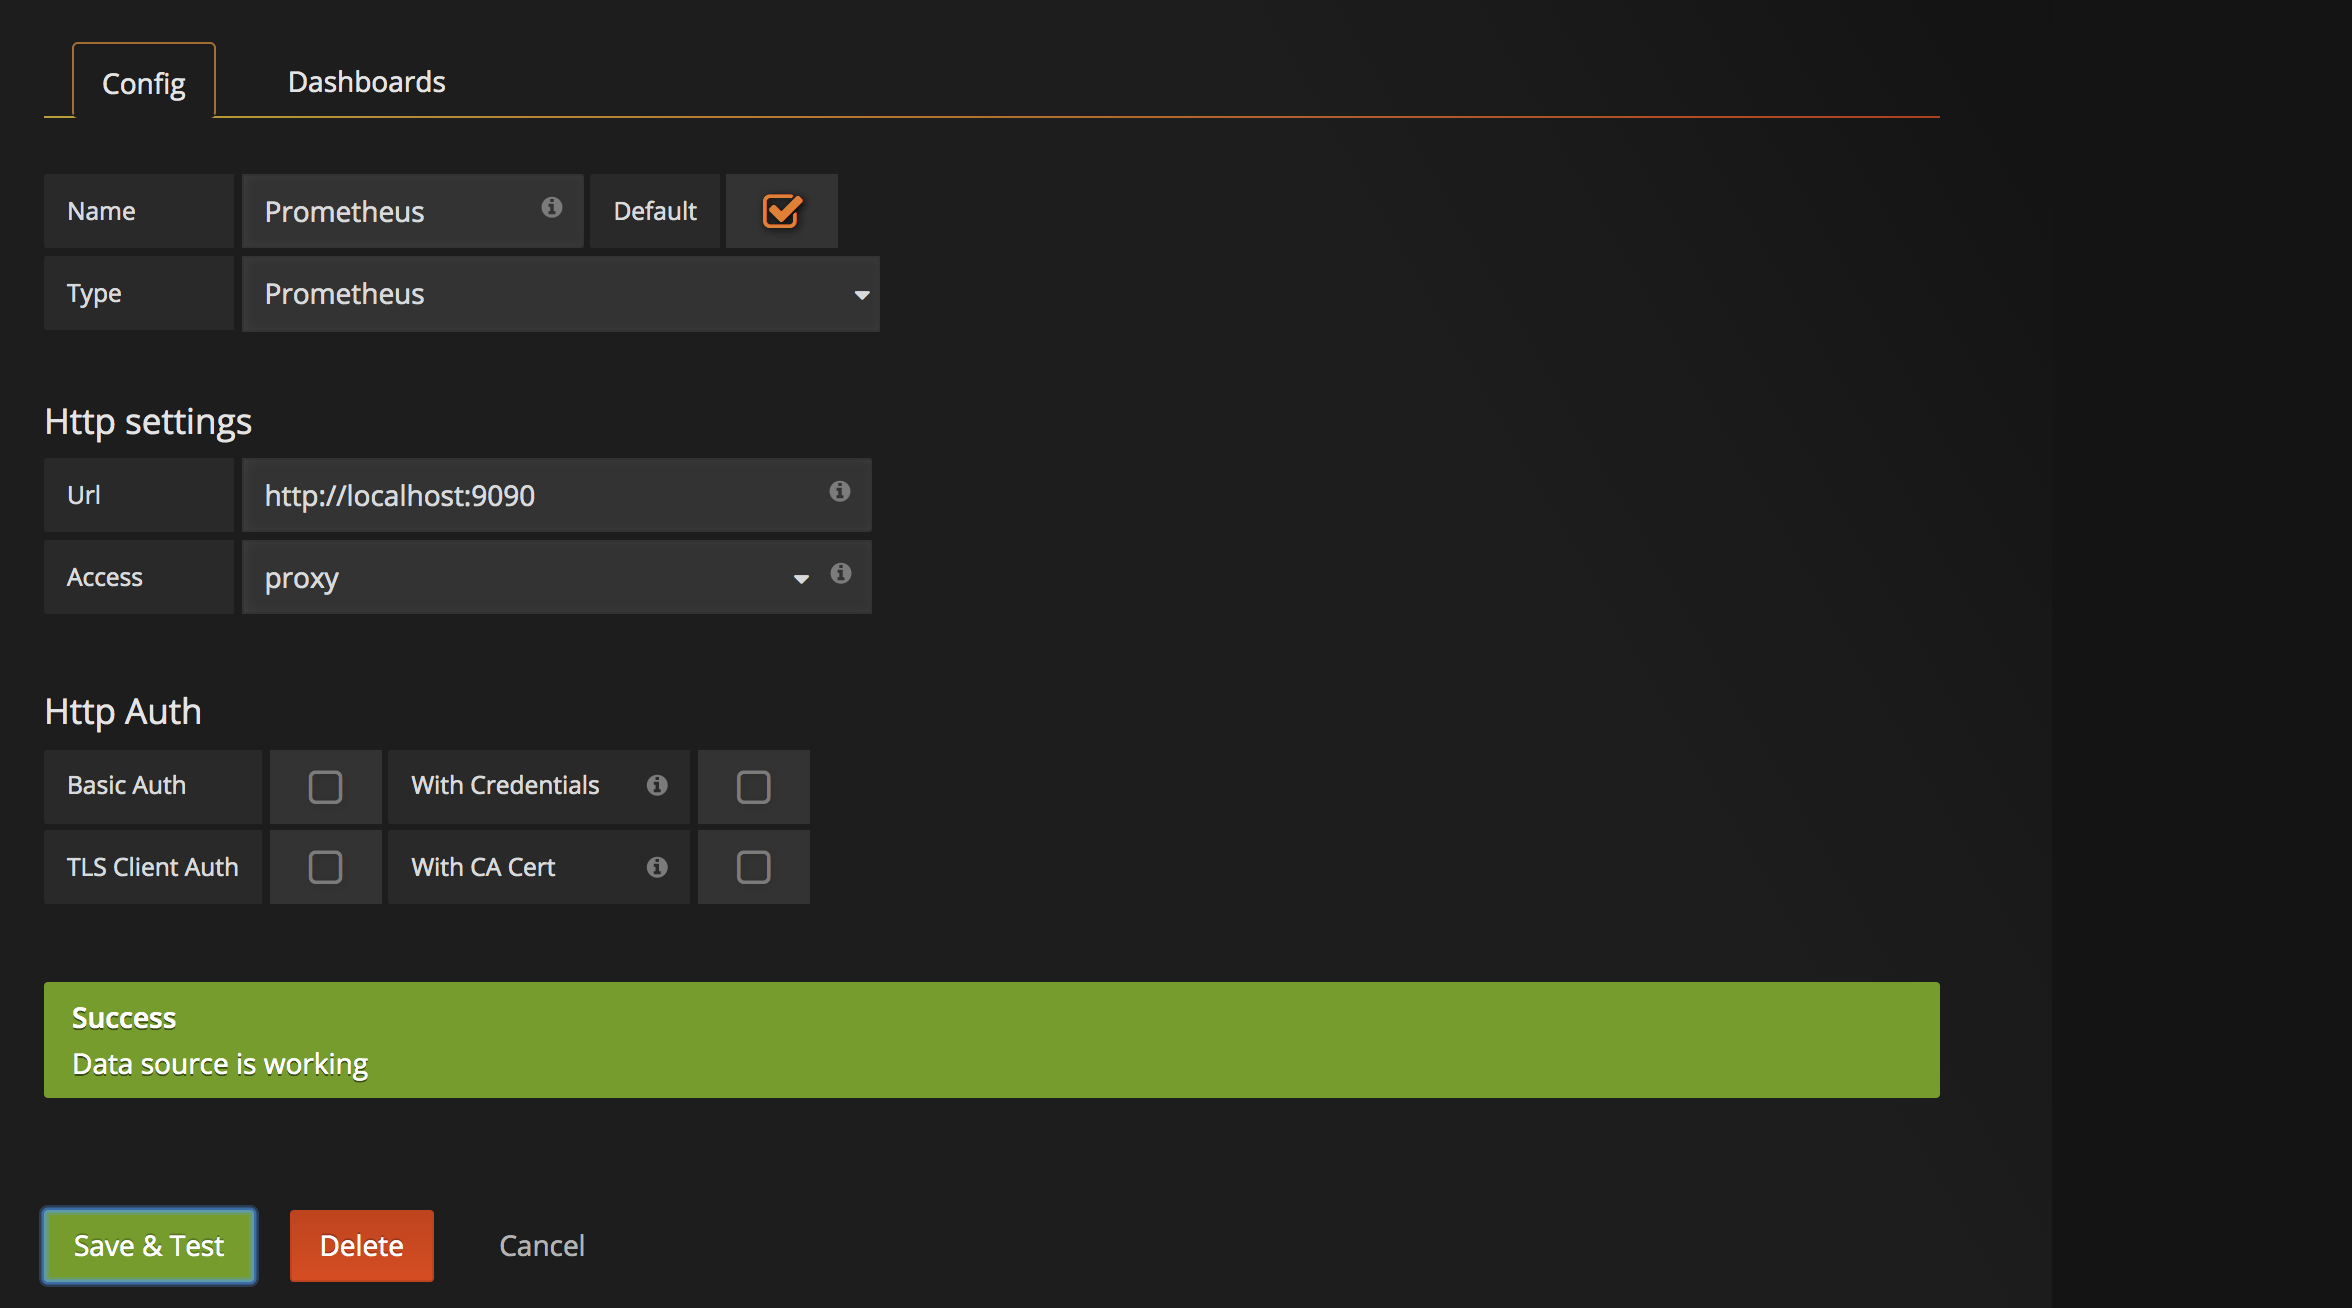
- 在Grafana中添加Prometheus数据源
1
2
3
4
Name:Prometheus
Type:Prometheus
Url:http://localhost:9090/
Access:proxy
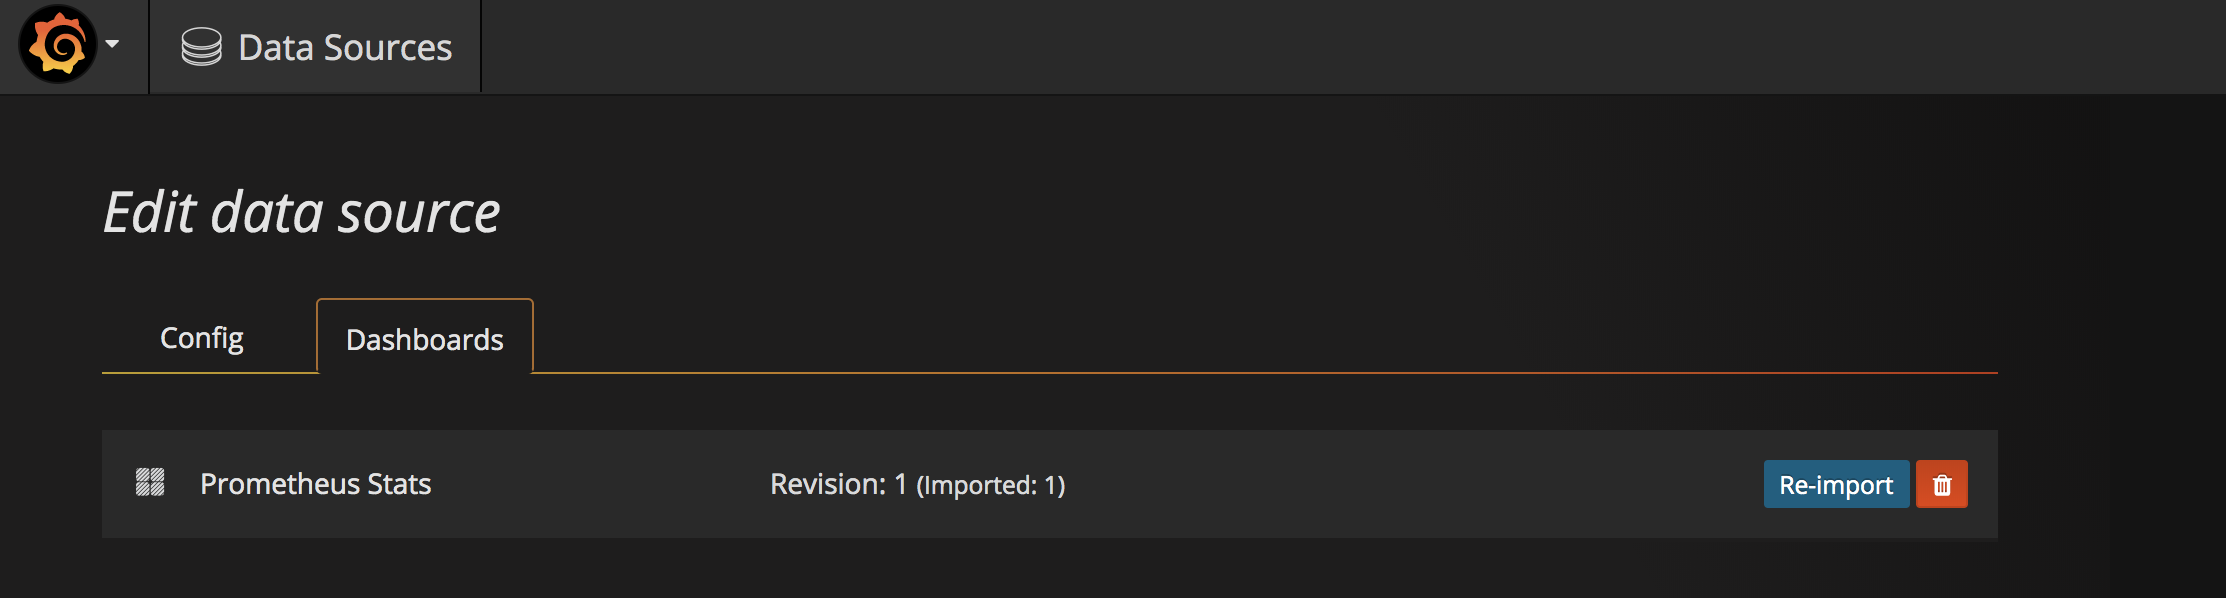
- 在Dashboards页面导入自带的Prometheus Status模板
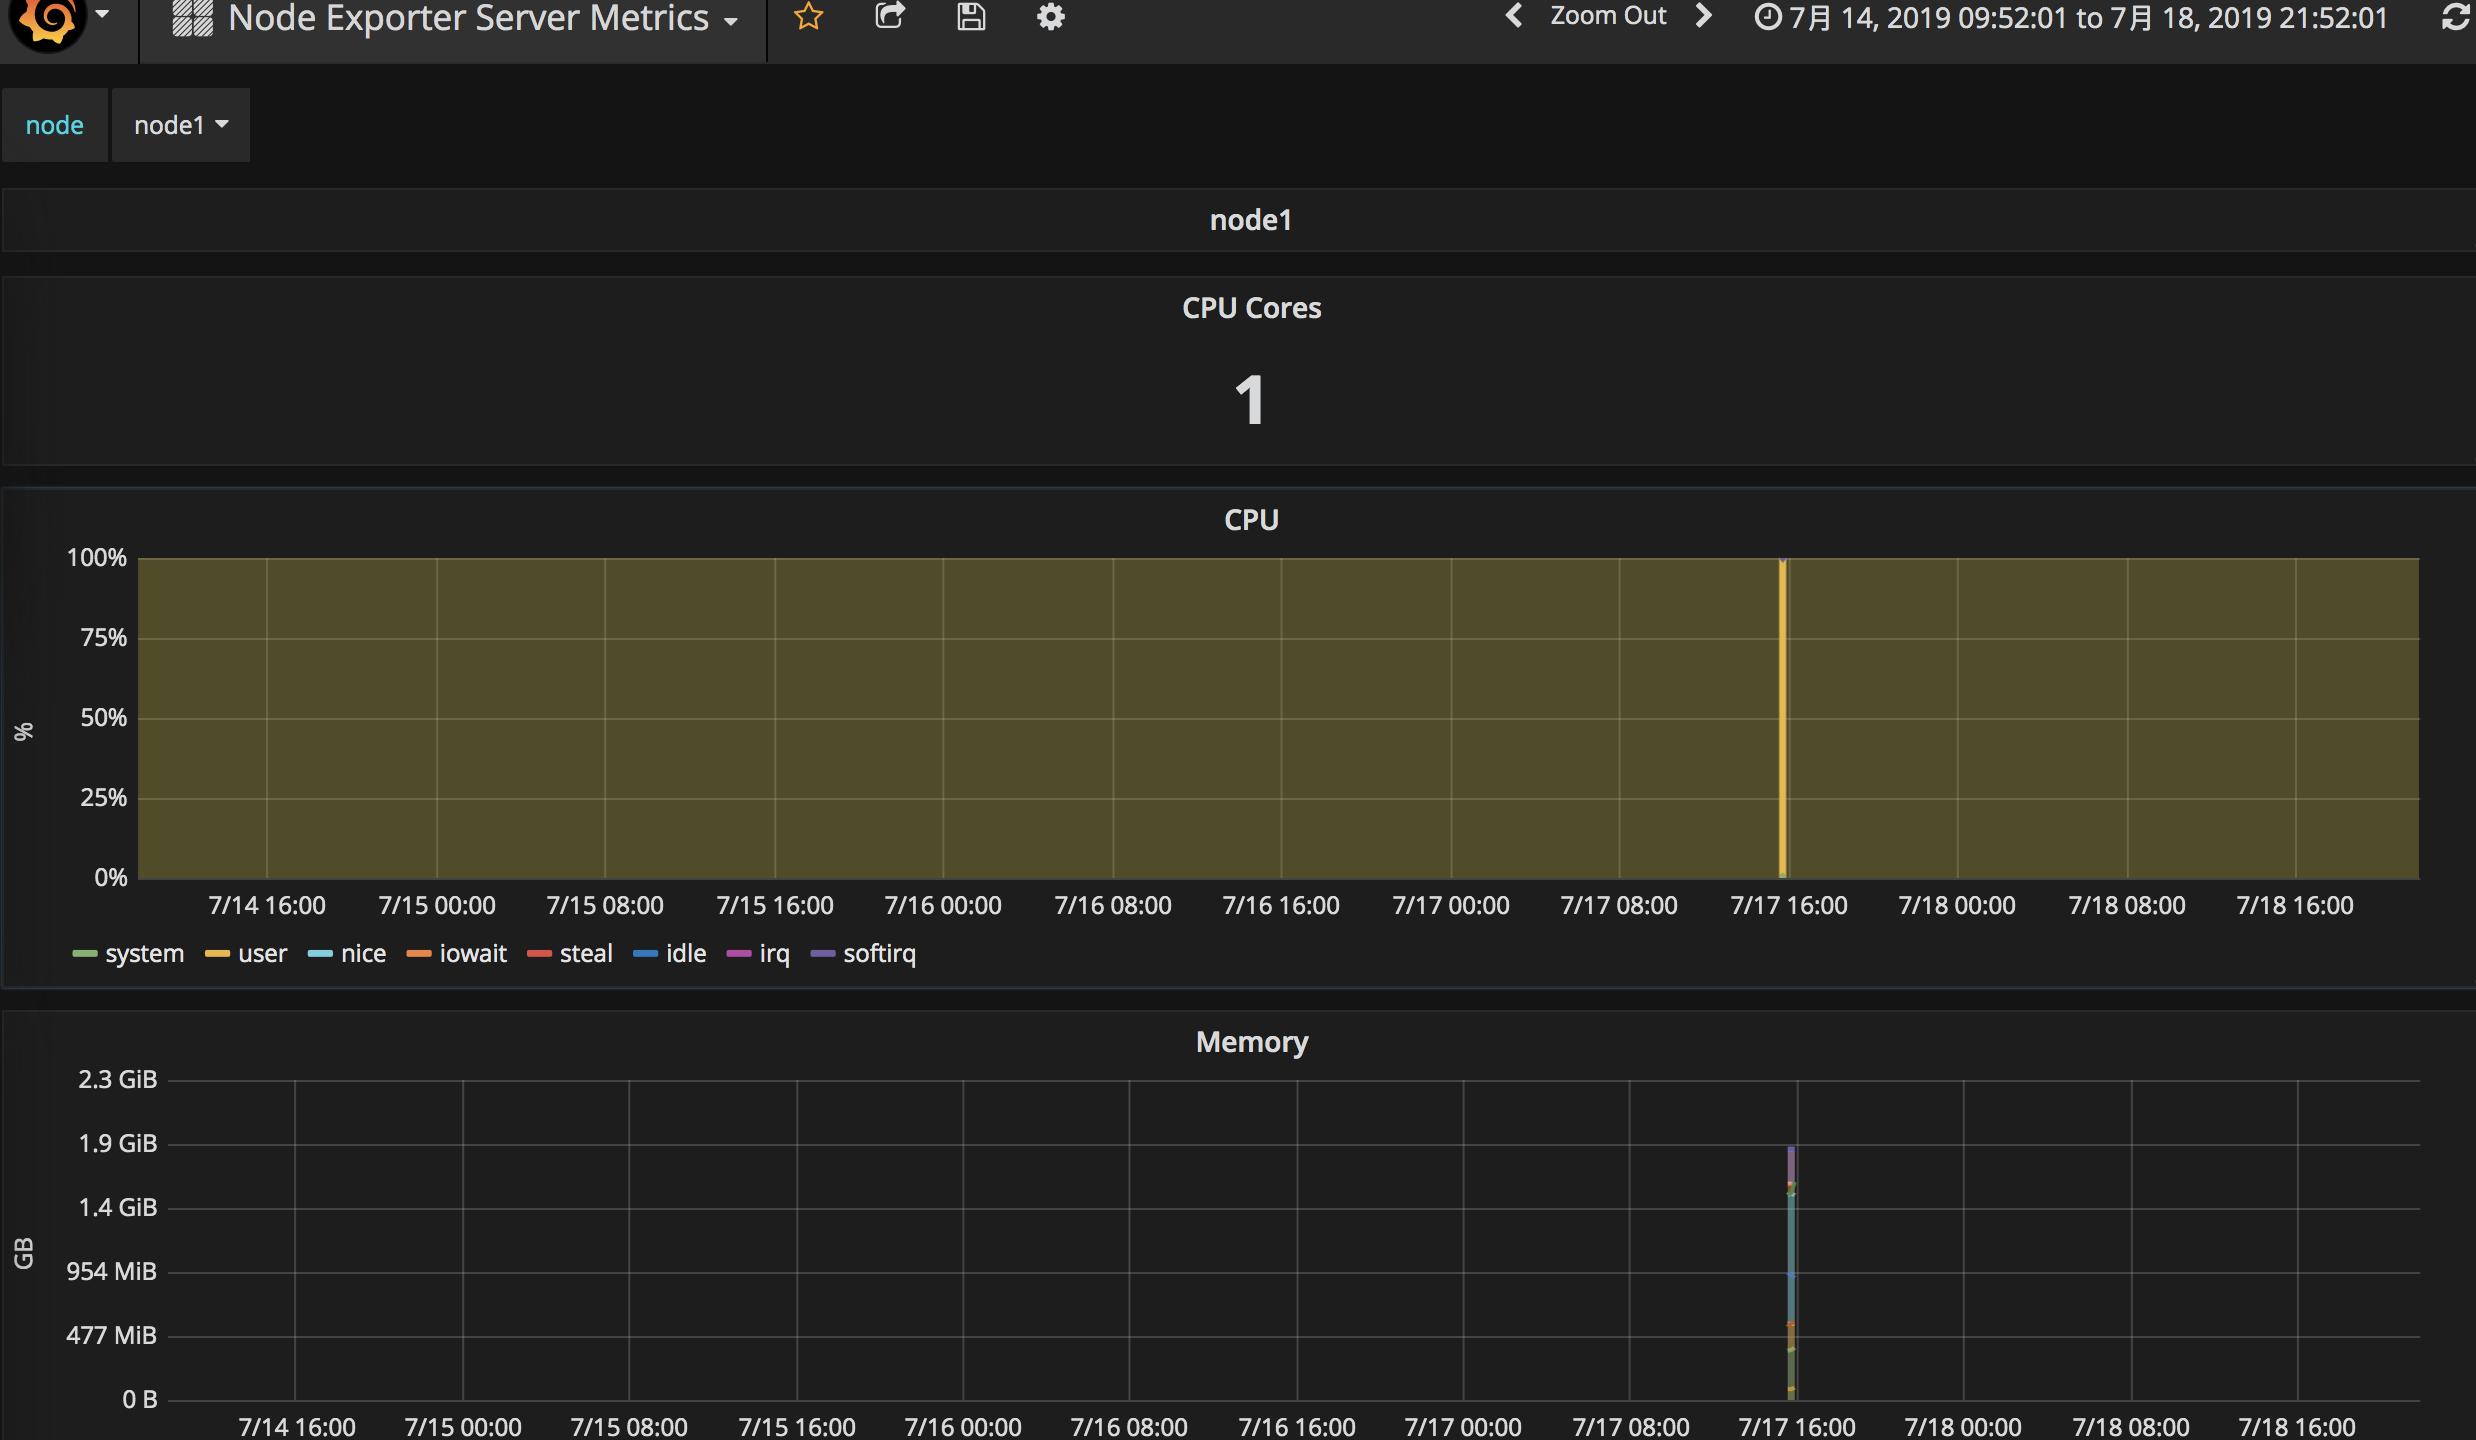
导入Node Exporter Server Metrics模板
访问https://grafana.com/dashboards/405,从这里下载Node Exporter Server Metrics模板的JSON文件。在Grafana–Dashboard中导入这个文件,数据源选择Prometheus。
访问Dashboards
在Dashboards上选Node Exporter Server Metrics模板,就可以看到被监控服务器的CPU, 内存, 磁盘等统计信息。
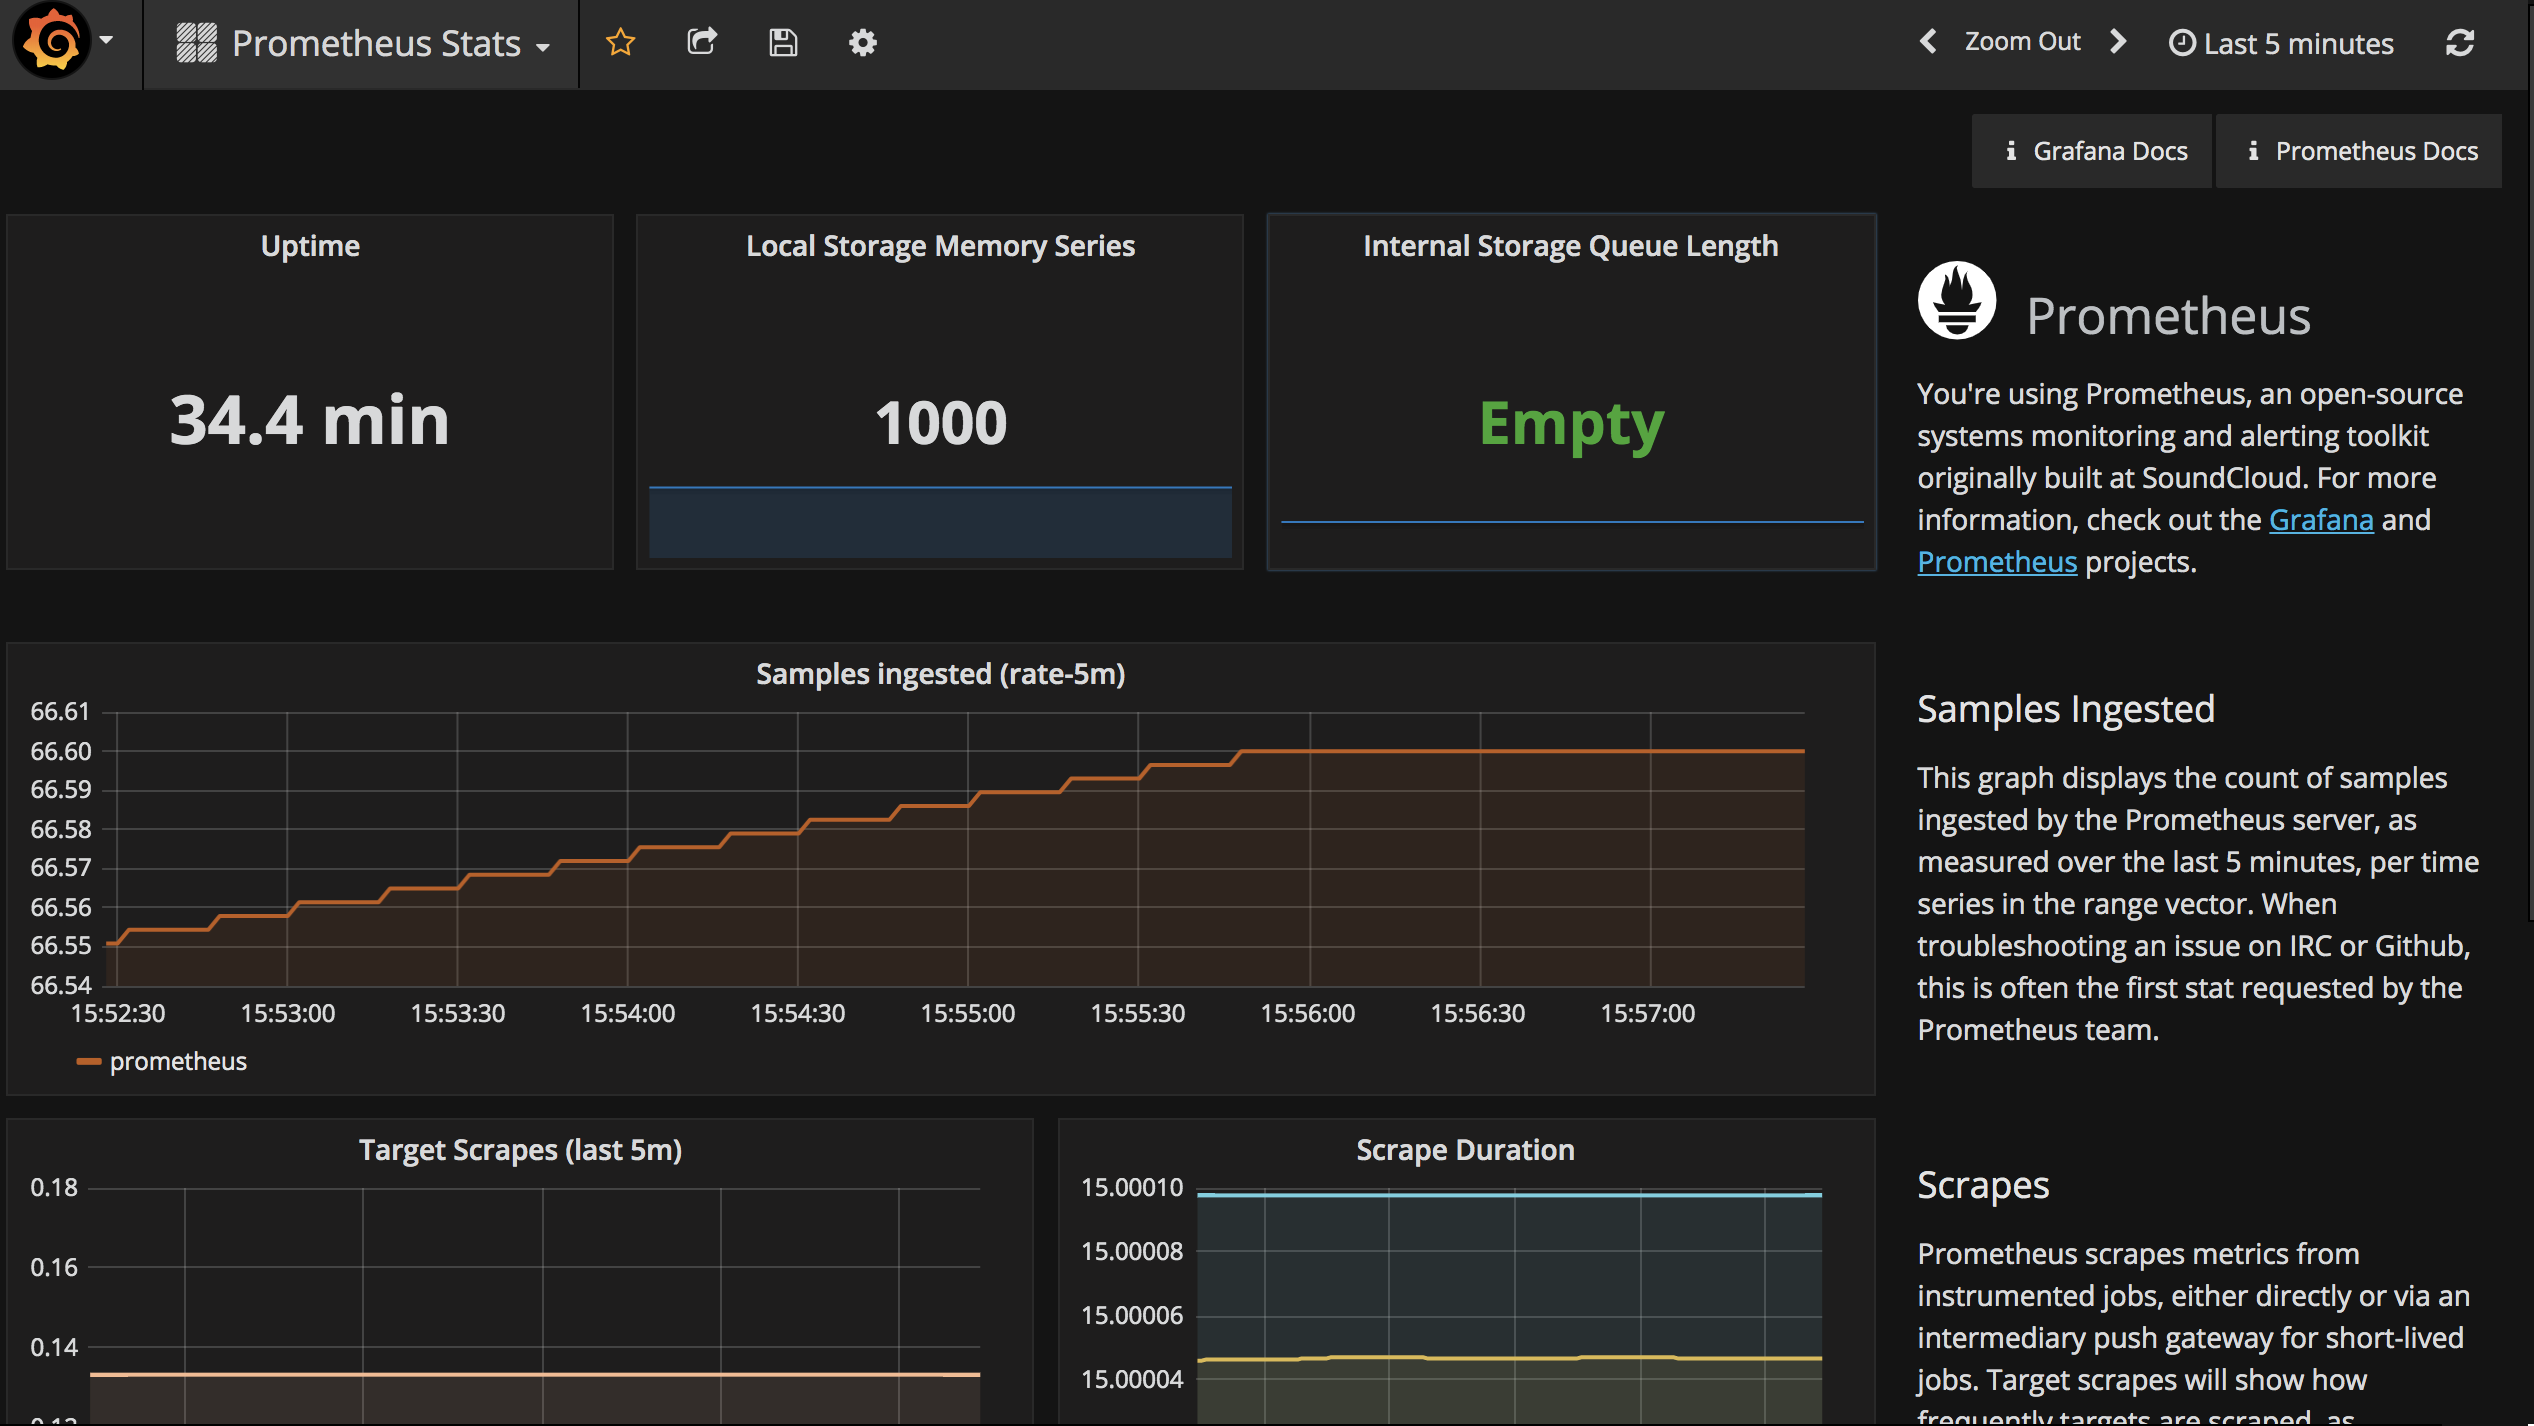
- 在Dashboards上选Prometheus Status模板,查看Prometheus各项指标数据。
参考文档:
https://www.hi-linux.com/posts/25047.html
http://www.google.com
https://github.com/1046102779/prometheus
http://liubin.org/blog/2016/02/18/tsdb-intro/
http://www.cnblogs.com/vovlie/p/Prometheus_install.html
https://www.addops.cn/post/Prometheus-first-exploration.html
http://blog.frognew.com/2017/02/use-prometheus-on-centos7.html